Project GEOData
Geneticists are really smart
I was a summer intern at AbbVie, a pharmaceutical research company. I got the chance to work in their R&D department. My first summer was supposed to be spent manually gathering data on hundreds of experiments hosted on the NCBI GEO website, but this was a very tedious and rote task that I thought would be more fun to make a program for. So I did.
Features
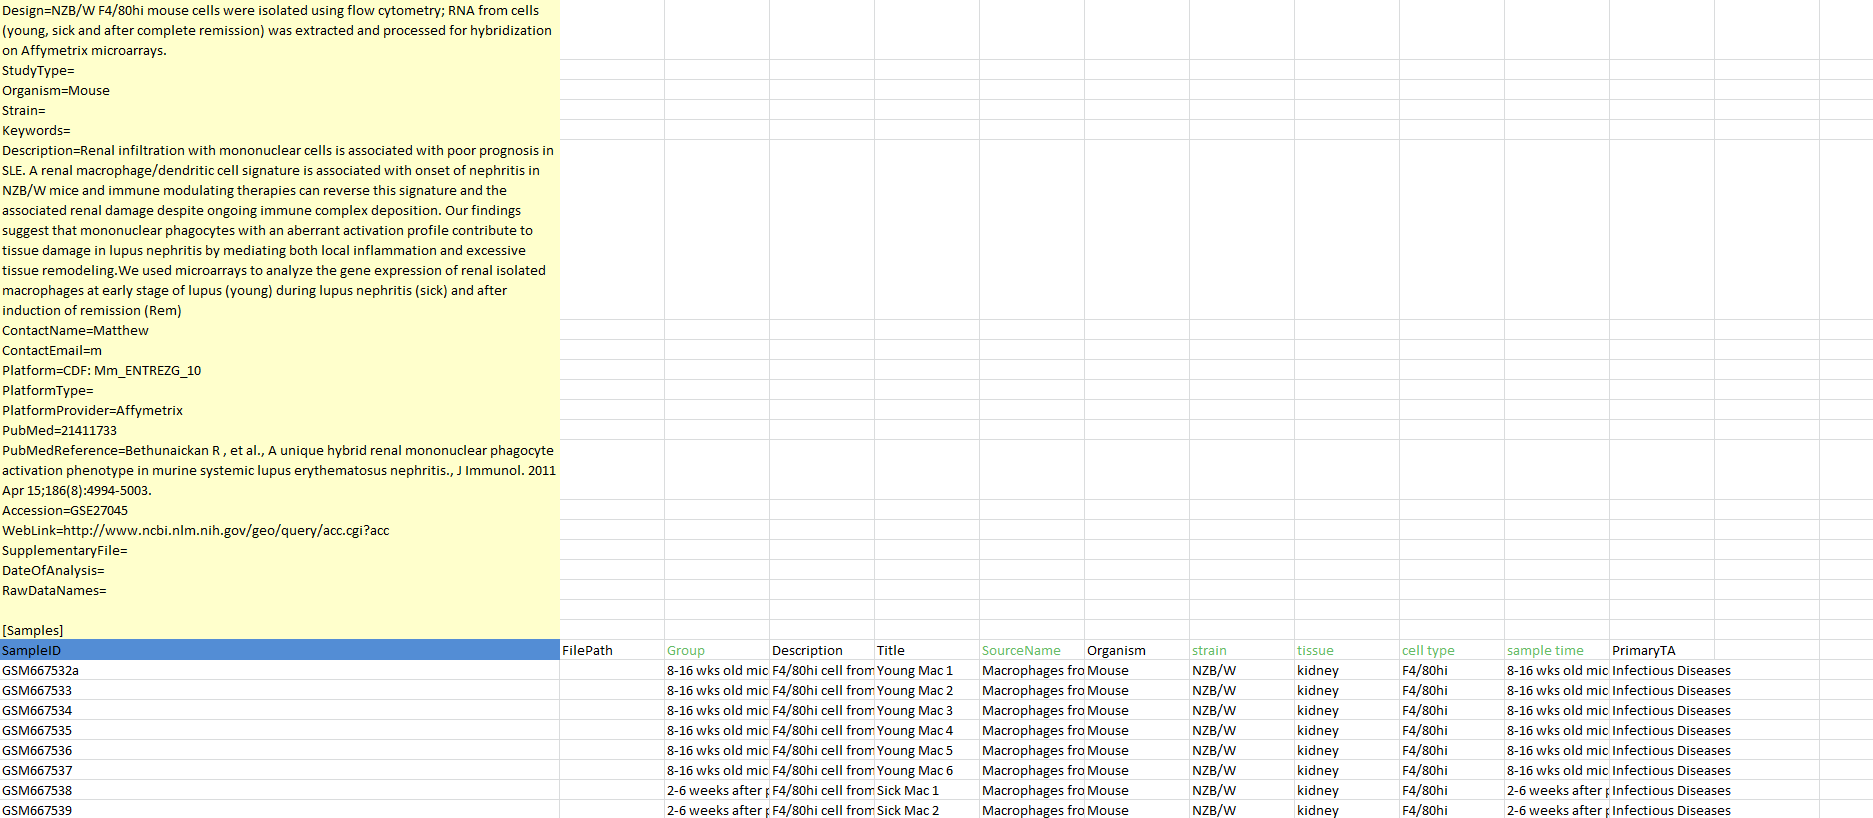
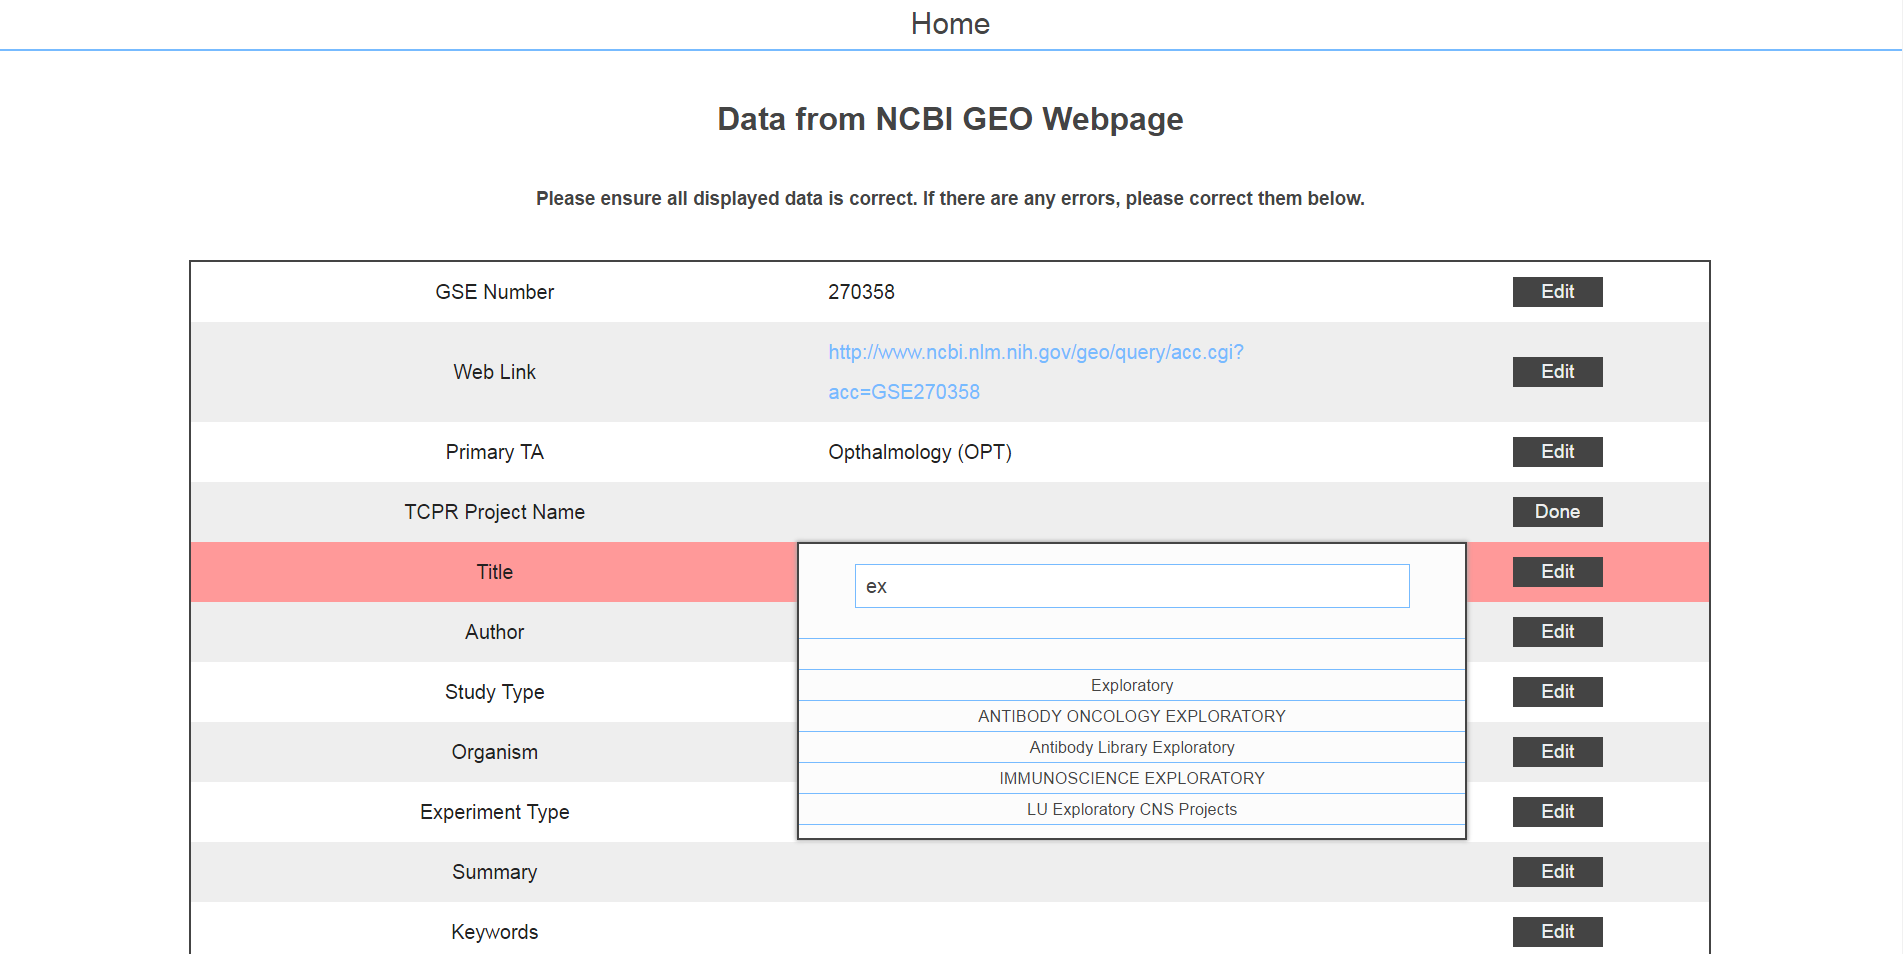
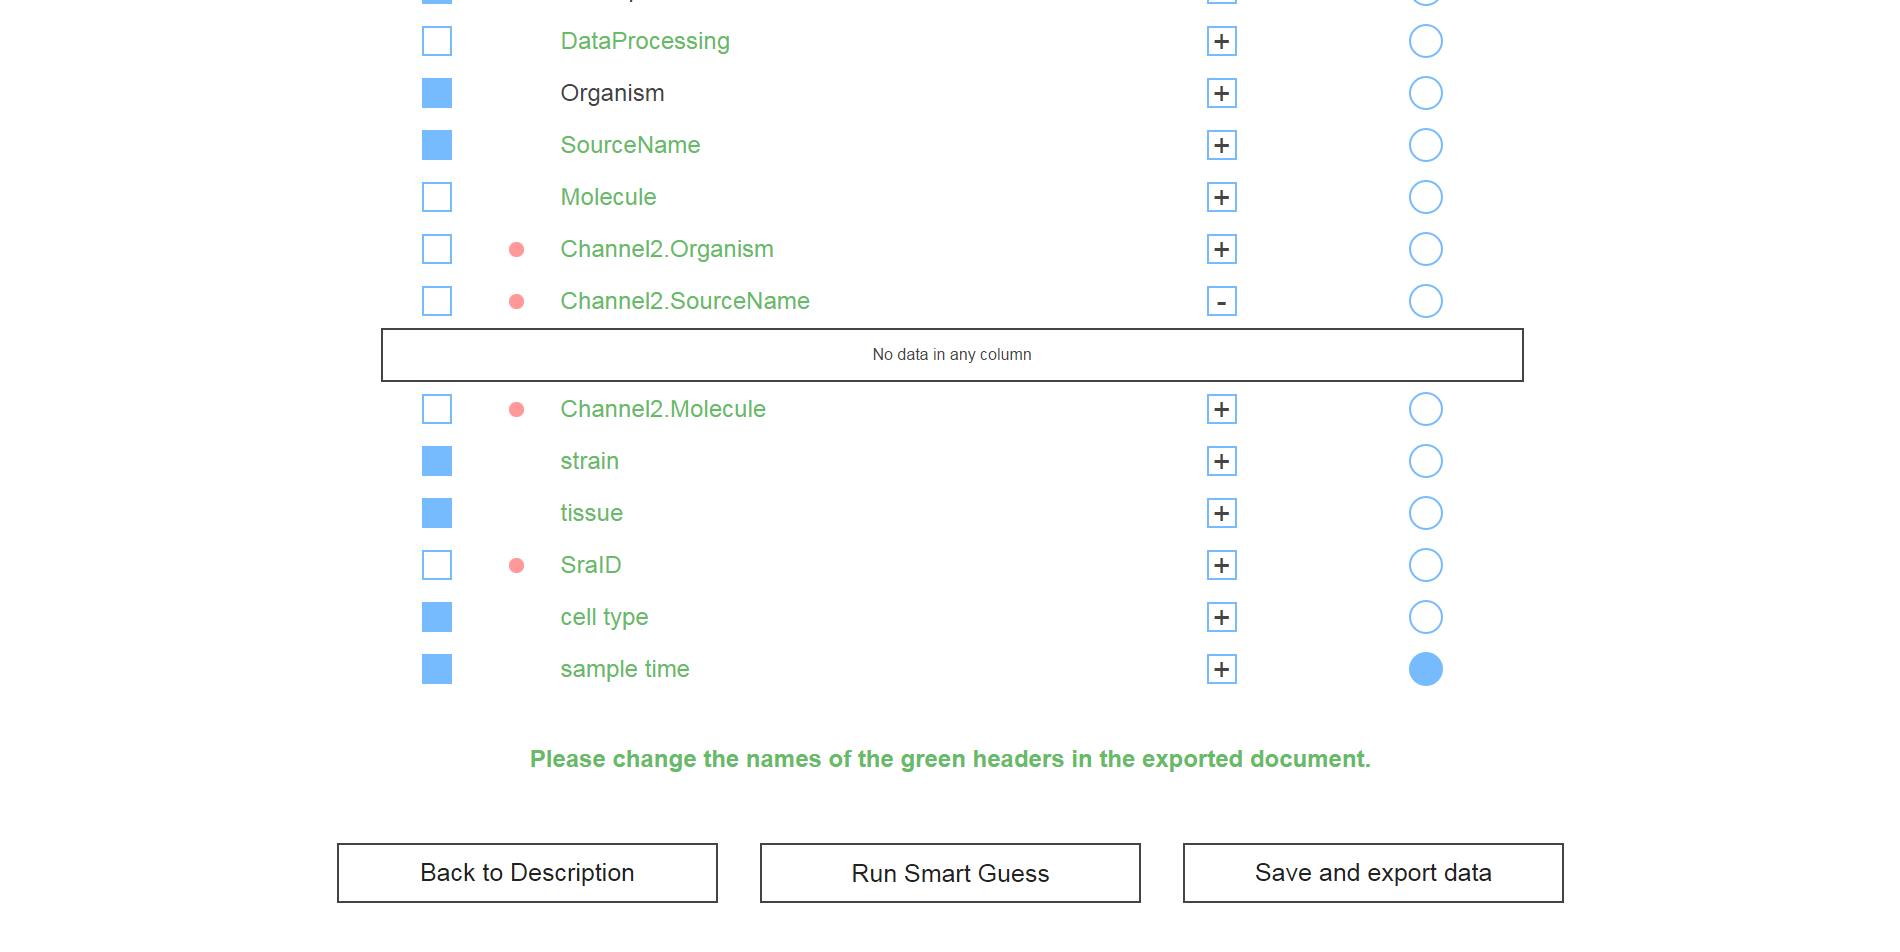
It was a fairly simple problem. Researchers would have an experiment description, let's say GSE27045, and with it they would have an associated "design" file that contained the actual experiment data. The task was to consolidate this data into a pretty format (see screenshot above) for easy access and develop an algorithm to find out which data columns should be included (some were blank, had garbage data, etc.) as well as which column should be designated as the "group" column, which was used to segment the data in terms of control and variable groups.
To do this, I wrote a web scraper that loaded a specific page and looked for the specific HTML tags preceding the information I wanted. Crude, but efficient. From there, I displayed all of the attributes and allowed the user to change anything that looked wrong.
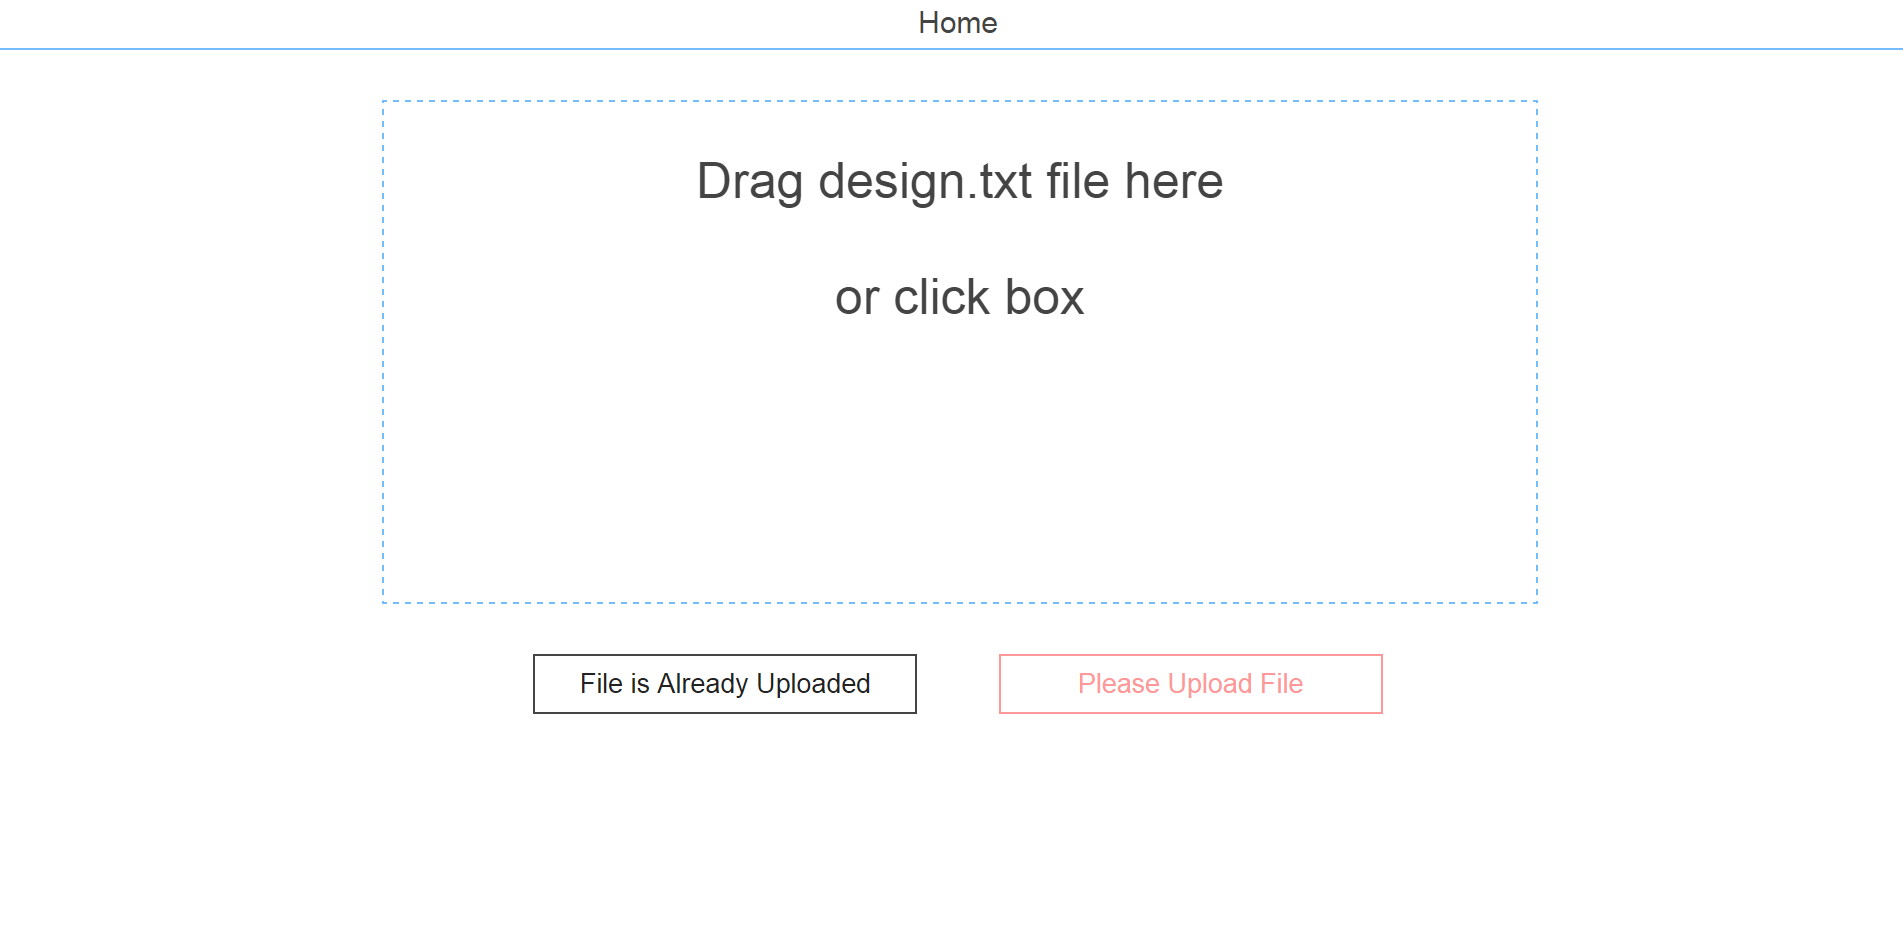
The next page asked for the researcher to upload the design file. I honestly don't know where these files came from; I'm assuming they were from microarray machines.
The design file was scanned and a few algorithms were implemented to prune useless data. The resulting columns were loaded by default, but of course this was displayed to the user in case they wanted to keep it for some reason.
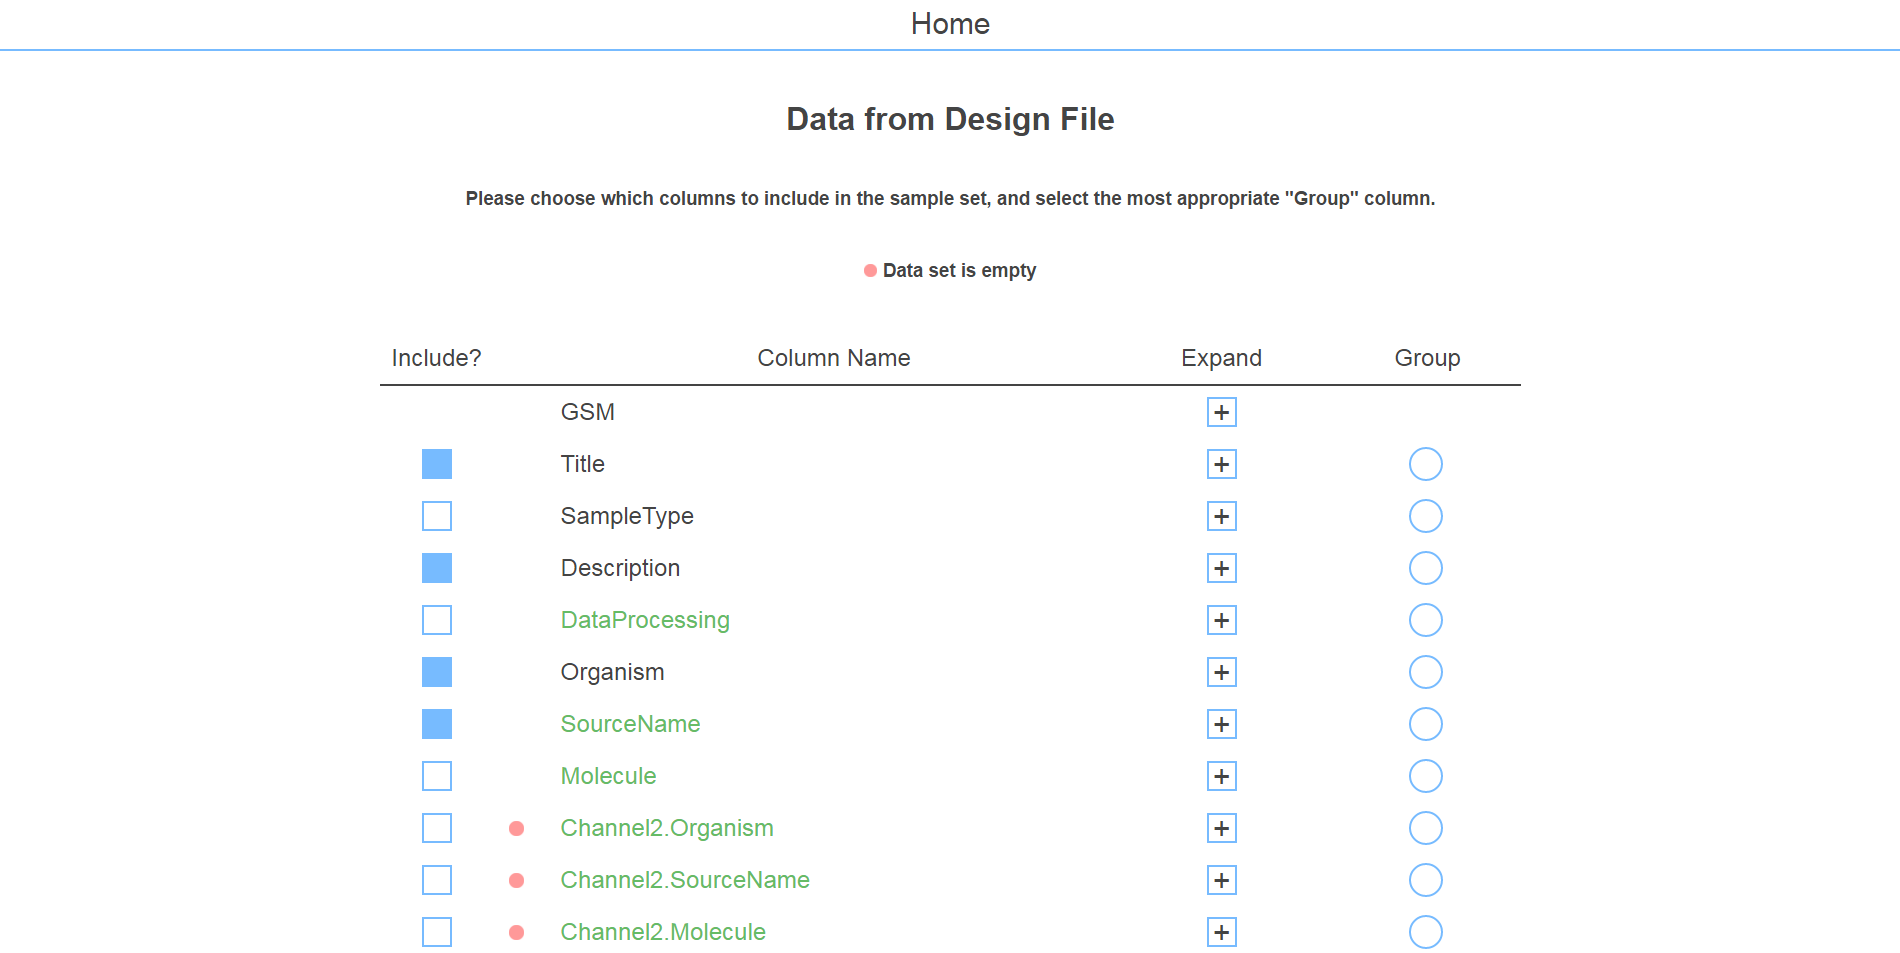
There was also a "smart guess" feature that allowed the user to run the algorithm that guessed which headers to include and determined the correct "group" column with about 95% accuracy. After that, all that was left was saving the data and exporting it to an excel file.
Implementation
Since I had previous experience with Django, that's what I used. Besides, Python is handy for data manipulation. The project was deployed to a Windows IIS server at AbbVie. Being my first run-in with Windows web hosting, it was quite the adjustment.
As mentioned, getting the experiment description involved hacking together an HTML parser. The NCBI GEO website was fairly standard, using a table to keep all of the data, so it wasn't a terriblly difficult feat. However, by some chance, the website updated in the middle of development, which caused me a great deal of confusion (exacerbated by page caching). Since that was fixed, it's been working fine.
The most interesting part of the project was the smart guess algorithm. Finding which columns were useful as well as which data column which was best used as a control vs. variable data set involved using a few tricks. First, a few keywords would consistently show up. For example, if a column had some data with "control", "diseased", or "treated" in their descriptions, it's likely that that column was meant to be the group column. I also employed some naive statistics, calculating the mean and variance of a couple of parameters; namely the number of words and number of unique words in each sample. Since the group control typically indicates groups of samples, there should be certain groups within the column. If all of the data entries are very similar or very different, it's likely it isn't a (proper) group column. Here's a snippet of the smart guess function:
# Performs simple functions on data to refine into desired_headers and determine most proper Group column
            def smart_guess(data):

            	header_list = {"desired_headers": [], "group": ""}

            	control_columns = []

            	for key, value_list in data.iteritems():

            		# Do not include DataProcessing
            		if "DATAPROCESSING" in key.upper():
            			continue

            		# If molecule (either channel) is the same data all the way down, do not include
            		if "MOLECULE" in key.upper():
            			if len(set(value_list)) == 1:
            				continue

            		# Checks if all data in column list is empty
            		list_empty = True
            		for value in value_list:
            			if value != "" and value != "RNA":
            				list_empty = False
            				break
            		if not list_empty:
            			header_list["desired_headers"].append(key)

            		# Checks if "control" is in columns and, if so, appends to list
            		for value in value_list:
            			if "CONTROL" in value.upper():
            				control_columns.append(key)
            				break

            	# If there is only one column with "control" in it, use that as the Group column
            	# If there is more than one column, pass those columns to unique_varance()
            	# If there are no columns, pass all desired headers to unique_variance()
            	if len(control_columns) == 1:
            		header_list["group"] = control_columns[0]
            	elif len(control_columns) > 1:
            		header_list["group"] = unique_variance(data, control_columns)
            	else:
            		header_list["group"] = unique_variance(data, header_list["desired_headers"])

            	return header_list
You can see that the first thing that happened was going through the data and sorting out which ones contained useless data and finding any columns with "control" in the data. If only one column ended up as a group column candidate, it was used. Otherwise, all candidates (or all non-useless columns, if there were no candidates) were passed into the unique_variance() function which used the keywords and statistics mentioned above to find the best candidate.
Learning Points
Most of the development time was spent on making the frontend look nice; after Project GymLocker, I wanted to make sure I got this one right. It ended up looking somewhat bare-bones, but intuitive and simple. A more artistic me might even say "minimalistic." There were also a few kinks I had to work out; I was doing a lot of new things, so lots of reading was required.
- 1. Parsing HTML is <str<ong>rough</and messy>
I didn't know what BeautifulSoup was, so that would have been helpful. It was still kind of fun to get into the guts of the problem, though. I wasn't even hesitant; I was so happy to have the chance that I just read up on how it was recommended then got to work. If I had to do it again, it would not involve counting tags and using find().
- 2. Windows documentation is hard to find / I didn't know how to google
There's something to be said about Microsoft's documentation in general, but IIS was particularly difficult to find. First of all, they introduced a new application called "Server Manager" in Windows 8, and everything I searched for relating to web applications seemed to redirect to that documentation. All I wanted was an easily-accessible page dedicated to explaining what IIS is and how to use it. How happy I would have been to have found iis.net in the first few days. Setting it up for my (not that) niche use case of Django was another nightmare unto itself involving FastCGI and many failed web.config files, but I'm lucky to have found a handful of well-written blog posts to help me through that.
- 3. Active Directory and LDAP need to die
I know I'm complaining a lot, but I honestly thought I would never come across a technology more unnecessarily confusing than Java. Writing LDAP queries for a schema you don't know (read: didn't write yourself) is like writing assembly with instructions inscribed on clay tablets. Why don't companies switch to SQL databases? Cost? Convenience? Legacy software? Sadistic management? I suppose this is one of those "intern tasks" that just never goes away. If you are ever in a position where this decision is up to you, be aware that every developer ever will curse you forever if you choose LDAP. We hated it seven years ago, and we still do.